TopStats Analytics Platform

TopStats started as a stats site for Discord bots. Charts, vote history and rankings for tens of thousands of bots, because the listing sites never kept any of it. Today it becomes something bigger: a general analytics platform for anything that emits data. Web and mobile apps, backends, game servers, Discord bots, internal tools, your own stack.
It is out now, free to start, and it lives on the root domain: topstats.gg.
The short version
Send events. Get dashboards. That is the whole product loop.
One endpoint, one API key:
curl -X POST https://topstats.gg/v1/events \
  -H "Authorization: Bearer ts_live_your_key_here" \
  -H "Content-Type: application/json" \
  -d '{
    "name": "purchase",
    "properties": { "amount": 9.99, "currency": "USD", "plan": "pro" },
    "_actor": "user_123"
  }'
That is it. An event has a name, whatever properties you care about, and optionally who it belongs to (_actor), where it came from (_source) and when it happened (_timestamp). No schema to declare up front, no migration to run when you add a property, no tracking plan to maintain before you get any value out of it.
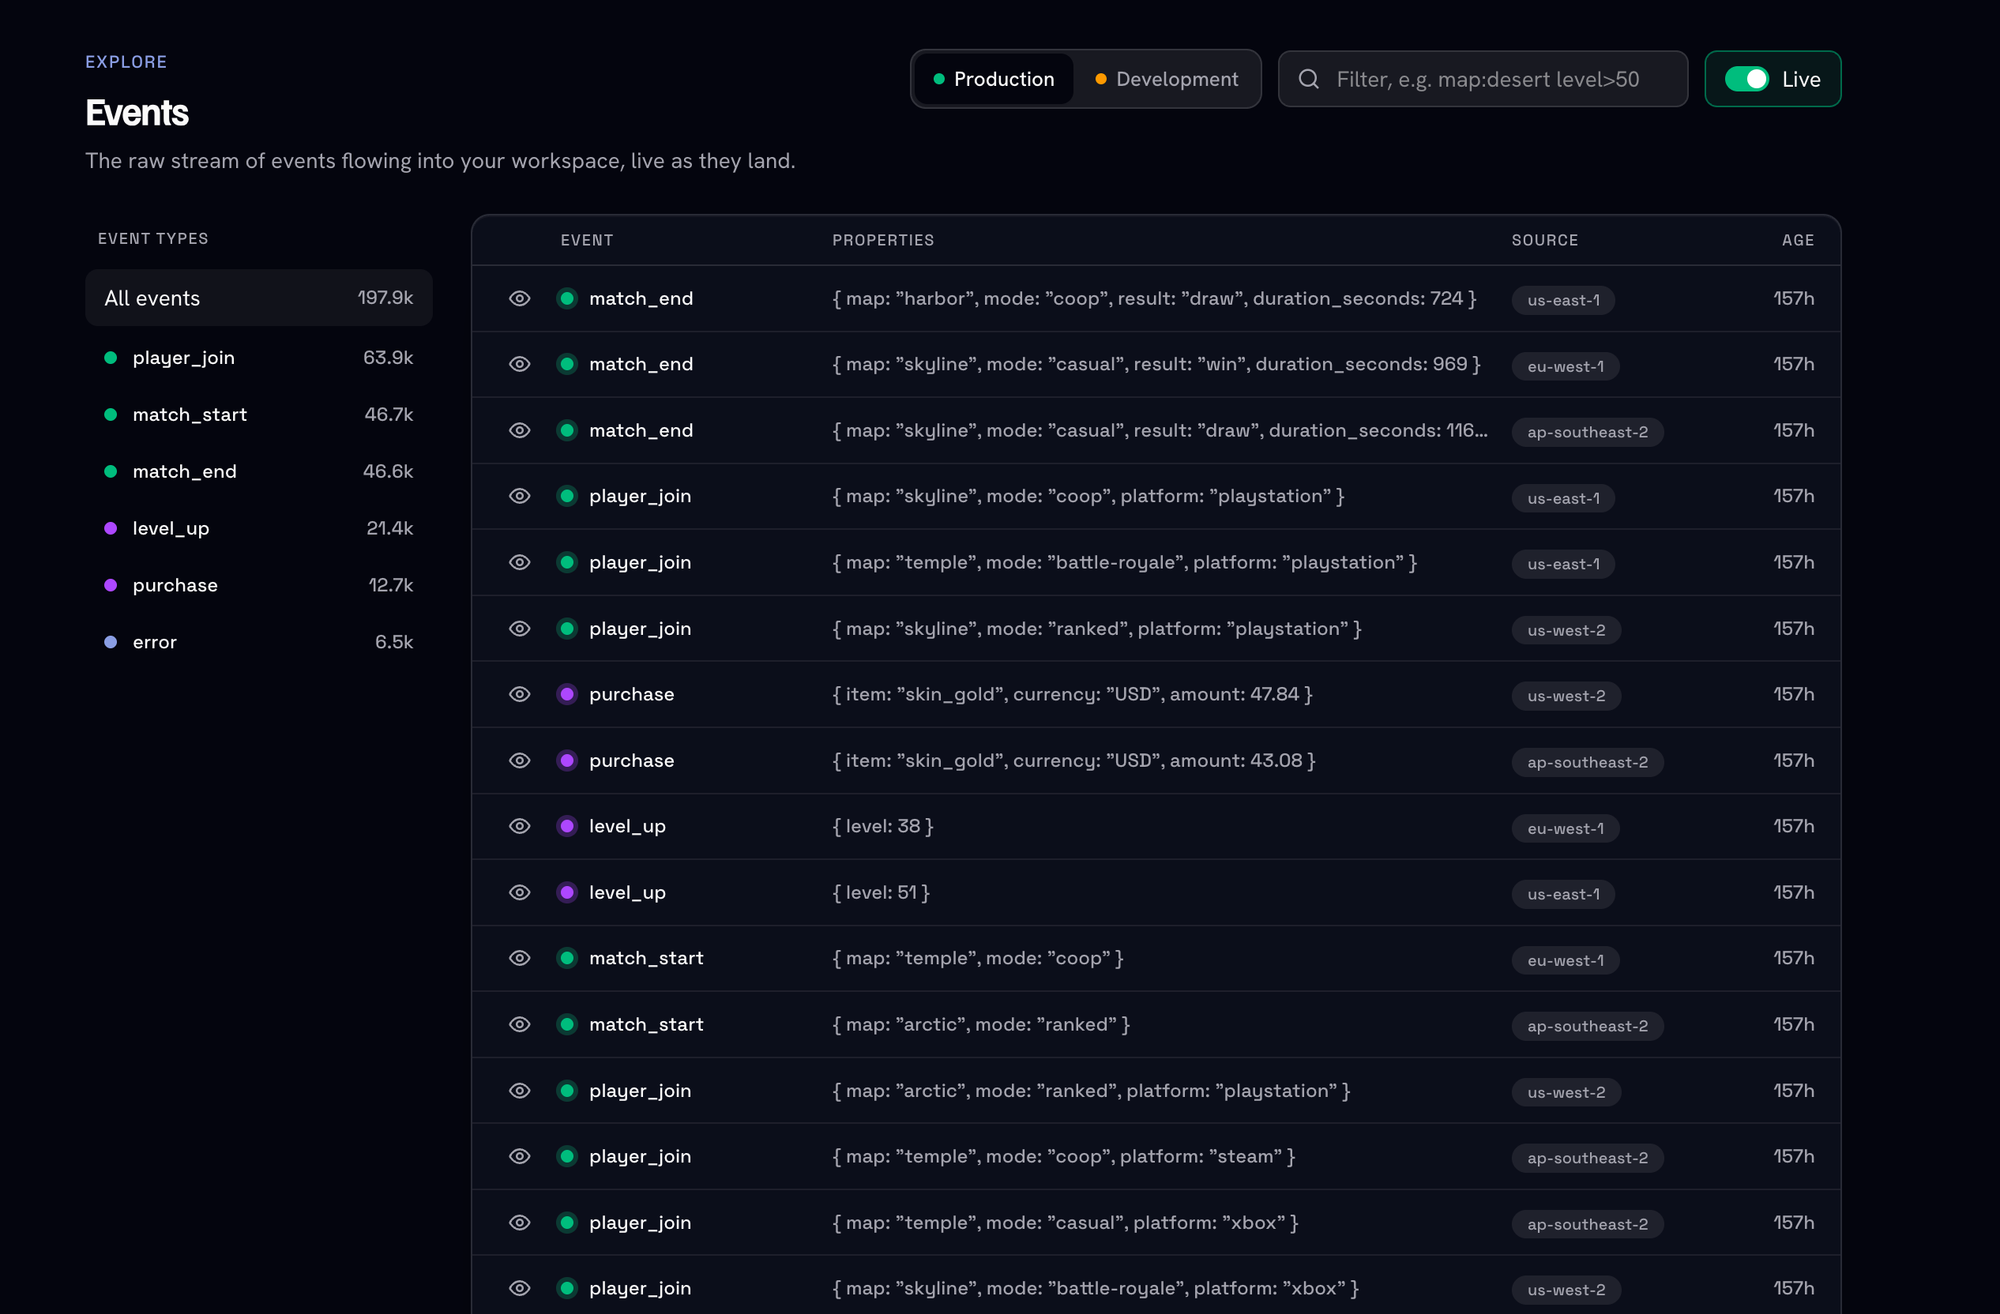
Every workspace gets two separate streams of data, production and development, decided by which API key you send with. Test events never pollute your real numbers.
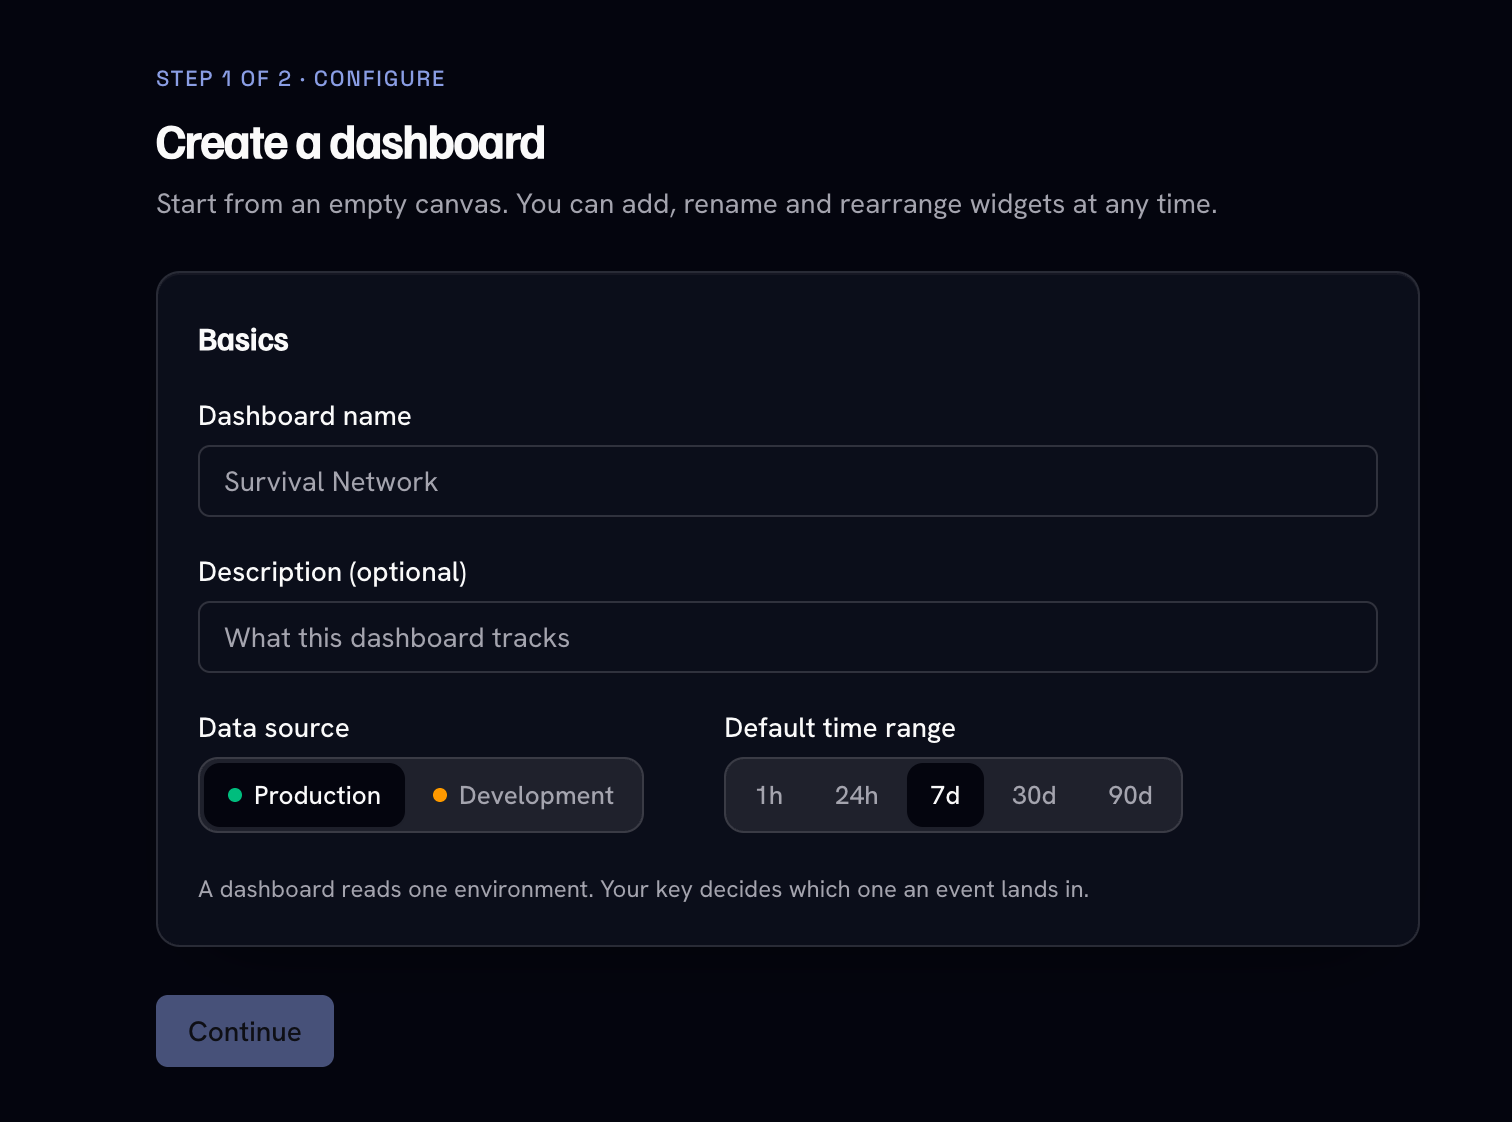
Dashboards that take minutes, not afternoons
The reason most analytics tools go unopened is that building anything useful in them is work. You either write SQL, or you fight a query builder, or you file a ticket with whoever owns the data.
TopStats is built the other way round. You pick an event, pick how to measure it, and a live preview shows the tile as you configure it. You never pick a "chart kind" from a list of twenty and hope it fits: the kind is derived from your config, and only the chart types that suit your data shape are offered.
What you can put on a board:
- Metric: a single number, a time series, or a breakdown by any property. Measure with count, sum, average, min, max, unique, median, 90th, 95th and 99th percentile, or standard deviation.
- Funnel: step-by-step conversion across ordered events, so you can see exactly where people fall out.
- Retention: a cohort grid of who actually came back.
- Table: raw recent events with the columns you choose.
- KPI row: several headline numbers side by side.
- Histogram: the distribution of a numeric property.
- Activity heatmap: counts by weekday and hour, for spotting when your traffic really happens.
- Note: a static text tile, for context and section headers.
- External: a single live number pulled from an API you allowlist, for a figure that does not belong in your event stream.
Counters show the change versus the previous window automatically. Filters narrow any widget to just the events matching your conditions. Saved segments let you define an audience once and reuse it everywhere. Annotations drop a vertical line on your charts for deploys and releases, so a spike arrives with an explanation next to it instead of a Slack archaeology session.
There is also an Actors view: pick a person, server or tenant and see their whole history, first seen, last seen, and every event they produced.
When a board is worth showing other people, the Share dialog gives you a read-only public link (topstats.gg/share/<slug>), an iframe snippet for embedding it in your own site or docs, and scheduled email digests, daily or weekly, to a list of recipients.
Alerts, so you do not have to keep watching
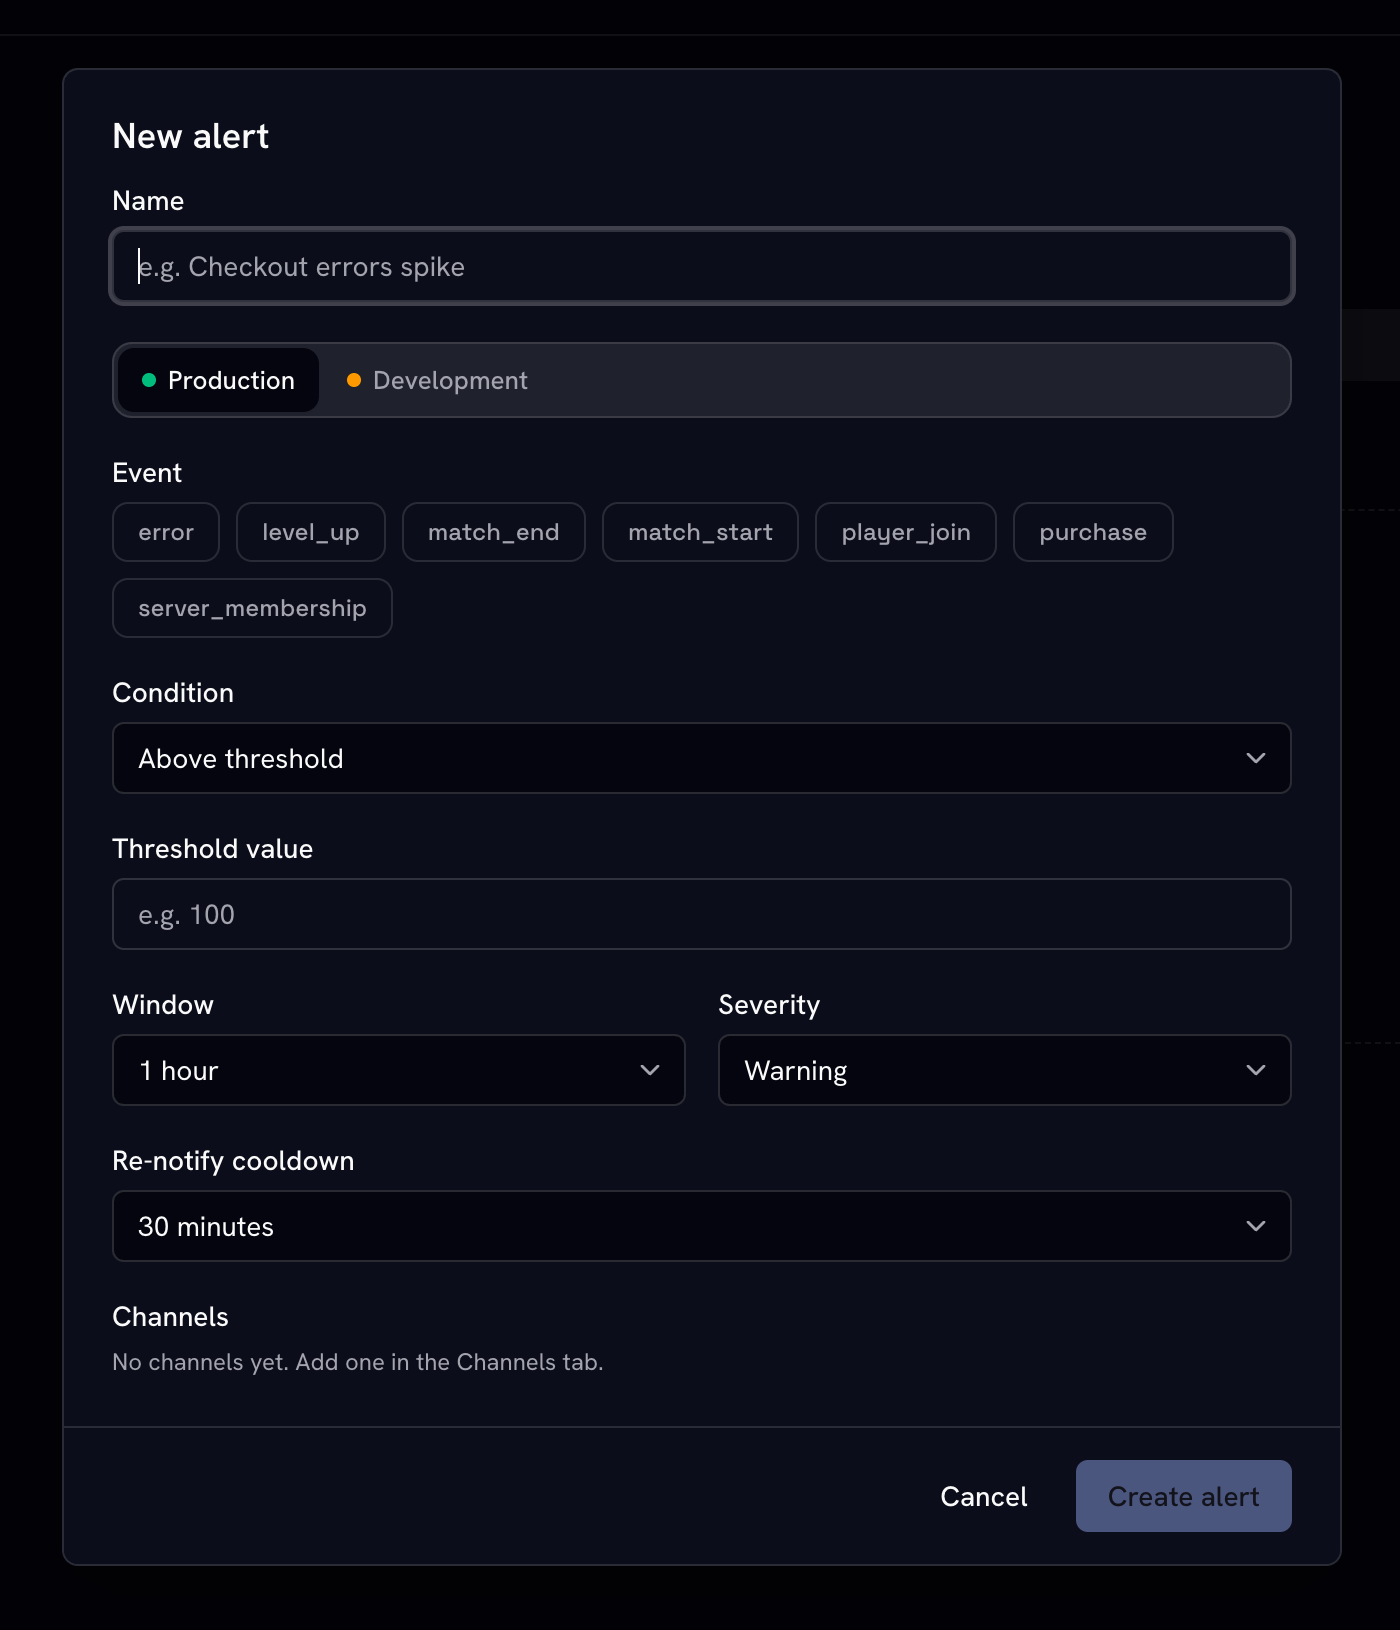
An alert watches one metric over a rolling window and tells you when your rule breaks. Six conditions: above, below, rises by X percent, drops by X percent, no data at all (a silence alarm), and anomaly, which compares the current window against its own recent normal instead of a threshold you had to guess.
Notifications go to Discord, Slack, any https webhook, or email. Every fire and resolve is kept in an activity history, and a re-notify cooldown stops a long incident turning into a hundred pings.
The domain move, and the redirects
Analytics now owns the root domain, so a few things moved. Nothing breaks.
- topstats.gg is the analytics platform and the API. Ingest and every API path live under
/v1/on that origin. - bots.topstats.gg is the Discord bot stats product, still running, still free to browse, with individual bots at
/discord/bots/<id>. - Old links keep working. Previous URLs redirect to their new home rather than 404ing, so bookmarks, embeds and links in old Discord messages still land in the right place.
The nicest part: you do not have to remember any of that structure. Take any top.gg bot URL and add stats to it.
top.gg/bot/1234567890 -> bots.topstats.gg/bot/1234567890
That redirects straight through to bots.topstats.gg/discord/bots/1234567890. Four extra characters in the address bar and you are looking at that bot's full history instead of a single current vote count.
Pricing: a free plan you can build on, paid that scales by the million
Most analytics pricing is a wall of feature tiers designed to make you upgrade for one checkbox. TopStats has no feature tiers at all. Paid workspaces get every feature and unlimited team members. The only two things you pay for are how many events you send and how long you keep them.
Free, forever, no card:
- 2 million events per month
- 30-day retention
- 1 team member
- Realtime dashboards, funnels, retention, alerts, the full API
Two million events a month is our way of saying "give us a shot" more than anything. We don't want it to be expensive to scale either.
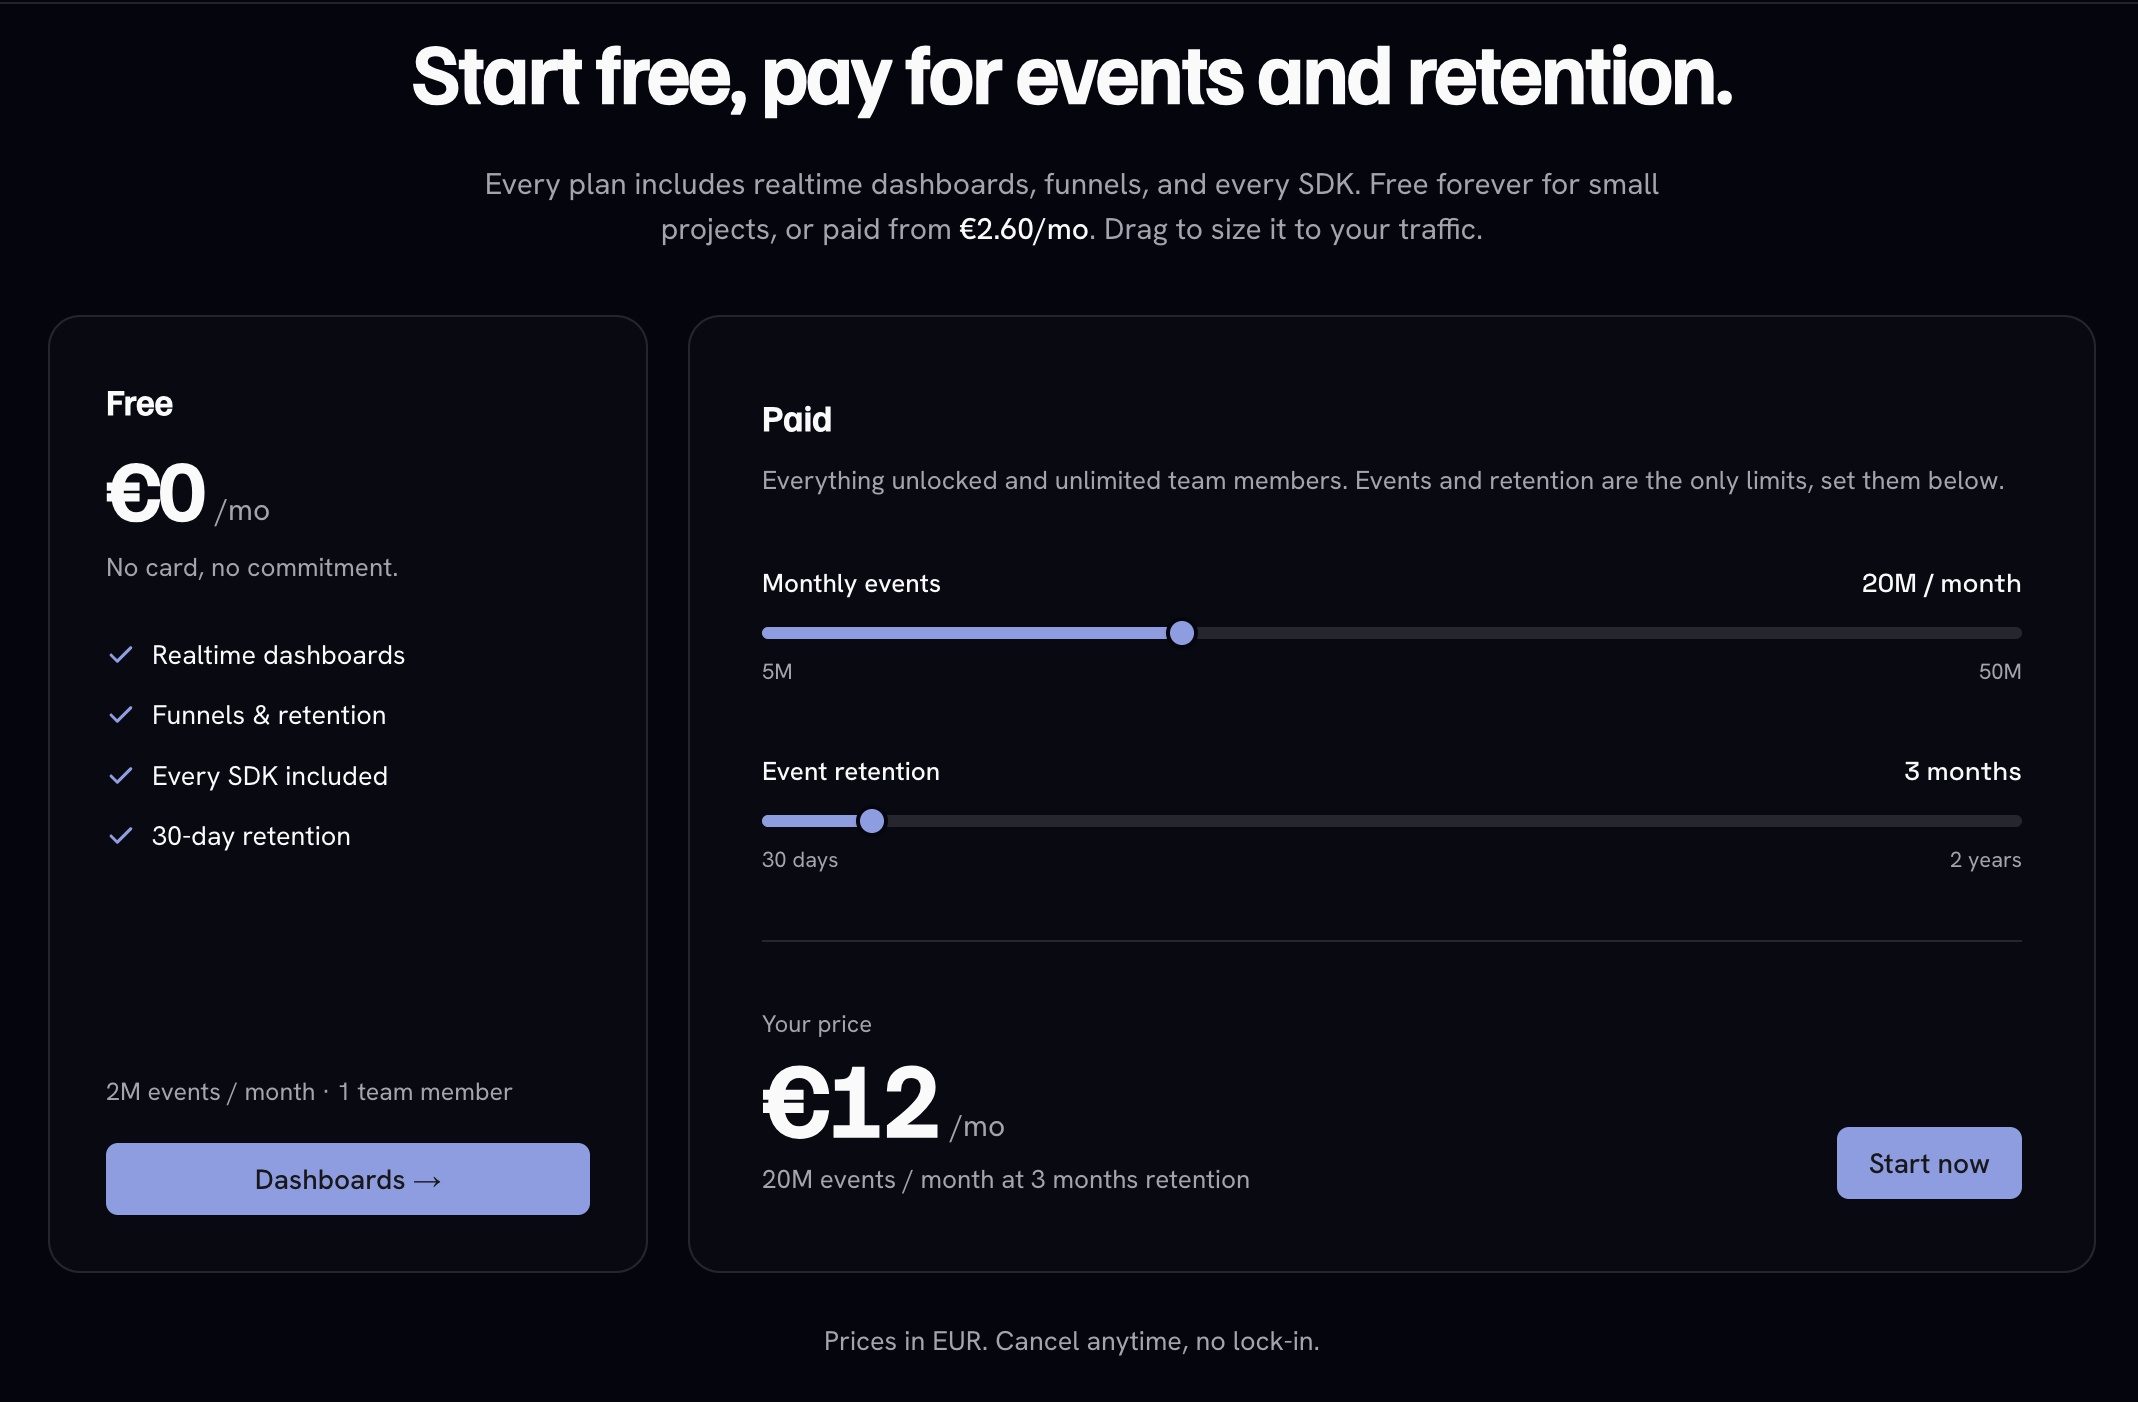
Paid, usage-based:
- From EUR 2.60/mo at the smallest volume and shortest retention
- EUR 3/mo for 5M events per month at 3-month retention
- EUR 12/mo for 20M events, EUR 30/mo for 50M events
- Retention from 30 days up to 2 years, priced separately, so you only pay for the history you actually want
- Unlimited team members and every feature, at every size
Two sliders, events and retention, and the price is the price. You can size a subscription to any whole million between those points instead of jumping between tiers. We don't penalize you for event spikes: go over your limit and you keep sending, we reach out to look for a solution, you lose no data as long as you upgrade by the next billing cycle. Only the free plan is a hard cap.
Your data stays yours. Raw events are exportable at any time. No sampling, no lock-in.
What is available today
- Available now: Node.js, JavaScript and TypeScript, or any raw HTTPS client (curl, fetch, your backend language's HTTP library). OTLP/HTTP endpoints for anything already emitting OpenTelemetry.
- Coming soon: game server plugins (Minecraft, Rust, FiveM, Garry's Mod, ARK), more language SDKs, and starter dashboard templates.
Getting started
- Create a workspace at topstats.gg and sign in.
- Create an API key in Settings, picking
productionordevelopment. The secret is shown once, so copy it. - Send your first event to
POST /v1/events. - Open a dashboard. It waits for that first event, then updates in near real time.
Full docs are at docs.topstats.gg.